Executive Summary
The Evolution of Design to Cost in the Green Deal Era
The manufacturing sector is confronting an unprecedented structural shift. The convergence of European Green Deal regulatory mechanisms—such as the Carbon Border Adjustment Mechanism (CBAM), the EU Emissions Trading System (EU ETS), and Extended Producer Responsibility (EPR) directives—alongside heightened market sensitivity, is transforming environmental product characteristics from mere compliance obligations into direct drivers of industrial and financial performance.
In this evolving landscape, the traditional Design to Cost (DtC) framework—focused on the ex-ante management of direct industrial costs—remains essential but inherently incomplete. Design to Green Cost (DtGC) represents its natural engineering and financial evolution. Far from being a theoretical environmental accounting framework or a standalone Life Cycle Assessment (LCA), DtGC is an integrated decision-making architecture that quantifies and exposes economic risks tied to environmental variables from the earliest product conceptualization phases—precisely when over 80% of a product’s lifecycle costs and environmental footprint are irreversibly locked in.
Shifting the control of environmental and economic costs upstream into the design process empowers manufacturing enterprises to transition from passive compliance to a proactive strategy of optimizing integrated operating margins (Green OpEx).
The limits of the Classic DtC model
One-Dimensional Myopia
Traditional Design to Cost (DtC) optimizes direct labor, raw materials, and factory overhead while ignoring latent ecological liabilities across the product life cycle.
End of the Free Externalities Era
Greenhouse gas emissions, scarp, and waste are no longer external factors: they directly impact operational cash flows.
Outdated Economic Formula
A linear “cradle-to-grave” model that exposes companies to severe margin collapse
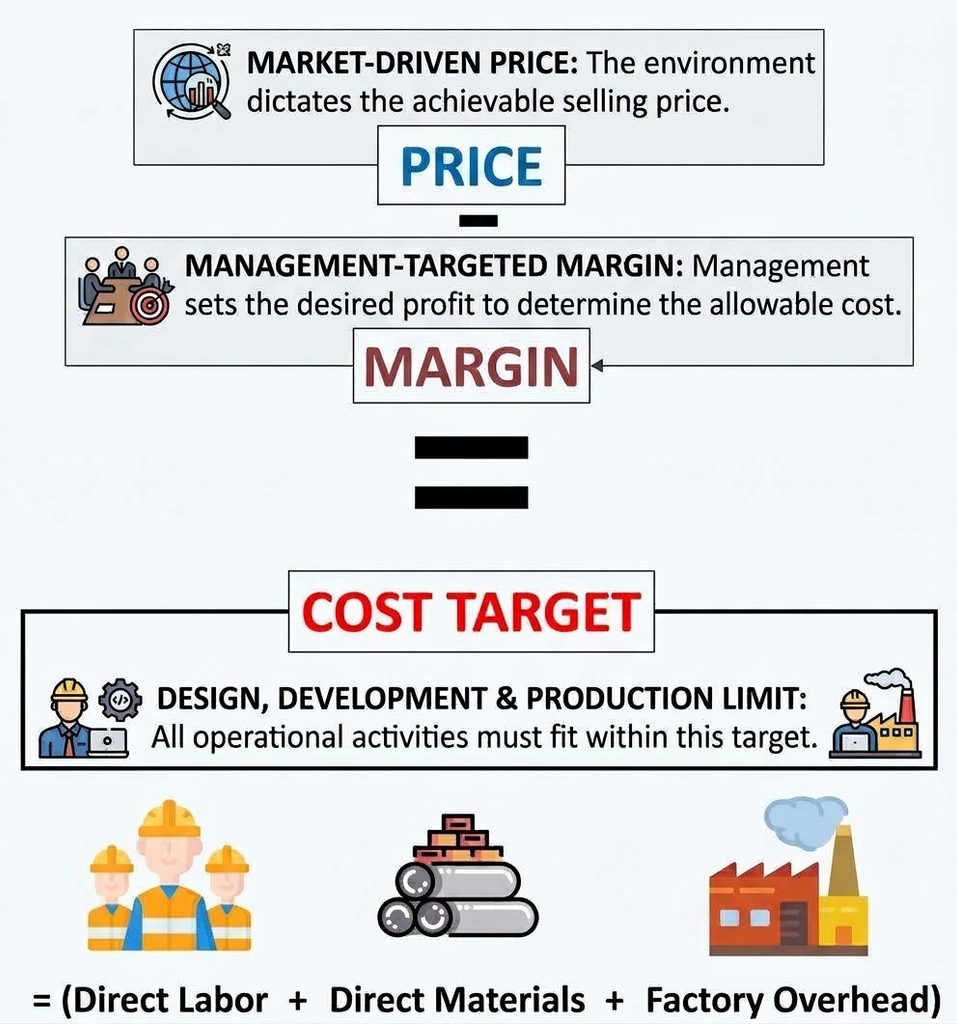
Price – Margin = Cost Target
Price: Market-driven
Margin: Management-defined
Target Cost: Operational boundaries
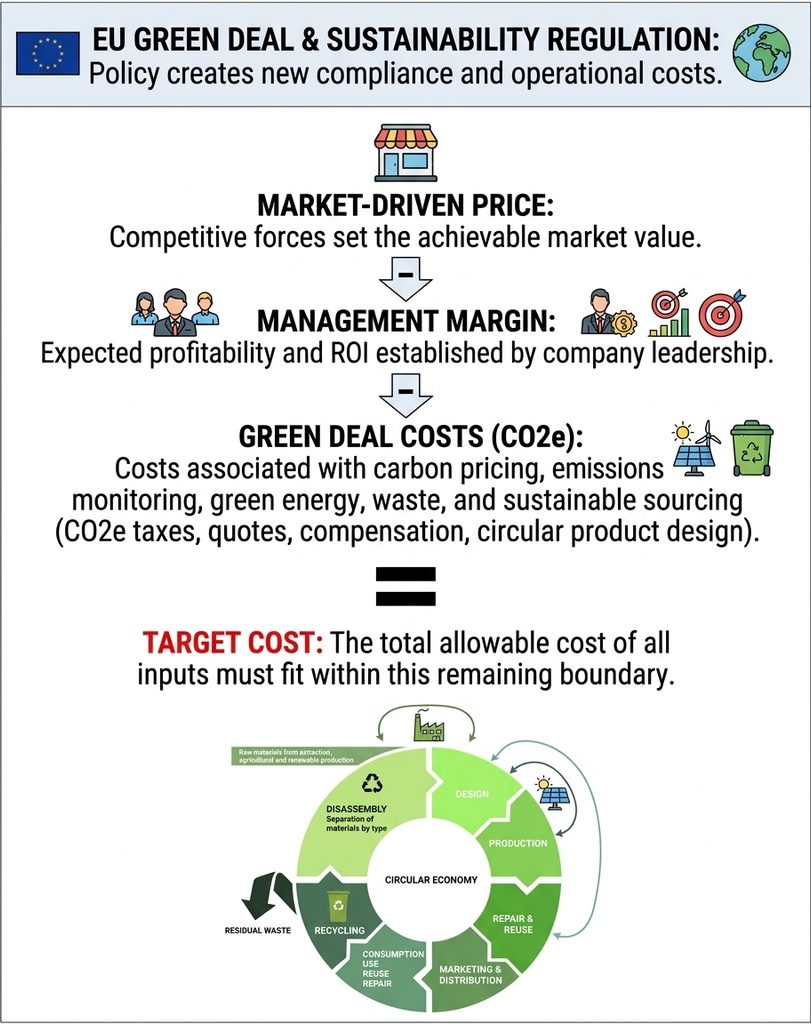
The New DtGC Value Formula
Emergence of the “Environmental Wedge”
Carbon emissions (CO2e) act as a binding financial subtractor: EU ETS quotes, CBAM tariffs, and End-of-Life (EPR) fees shrink the technical operating budget.
Preventive Circularity
Designing for disassembly, modularity, and closed-loop recycling converts environmental liabilities into positive cash flows at end-of-life (Cradle-to-Cradle).
Environmental Exposure :
- CBAM (Carbon Border Adjustment Mechanism) Enforceable from 2026: converts Scope 3 imported carbon footprint (steel, aluminum) into direct monetary customs duties.
- ESPR (Ecodesign for Sustainable Products): Mandates strict minimum standards for durability, repairability, and recycled content as legal prerequisites for EU market access
- ELV & EPR Directives (End-of-Life & Extended Producer Responsibility): Penalizes welded multi-material components with high disposal tariffs; rewards standardized single-material designs
- CSRD / ESRS & ESG Bank Rating: Scope 3 emissions are subject to financial audits. High-carbon product design leads to higher borrowing costs and interest rates
Price – Margin – Environmental Exposure = Cost Target
Conceptual Distinction: Physical Environmental Impact vs. Economic Exposure
To maintain the financial rigor required at executive board levels (C-Level), DtGC establishes a clear boundary between two concepts that are frequently conflated:
- Physical Environmental Impact: Measures ecological externalities estimated via Life Cycle Assessment (LCA) methodologies (e.g., kg CO₂e emitted, liters of water consumed, kg of waste generated). It serves as a physical metric essential for sustainability reporting, but lacks a direct, unambiguous link to short- and medium-term Profit & Loss statements.
- Economic Environmental Exposure: Represents the tangible or reasonably predictable financial burden resulting from environmental product characteristics. It stems from well-defined regulatory, market, and supply chain drivers.
Engineering and Financial Modeling of DtGC
Integration of Cost Engineering (CE) and Green Engineering (GE)
The operational engine of DtGC relies on the synergistic, parallel collaboration of two advanced technical disciplines:
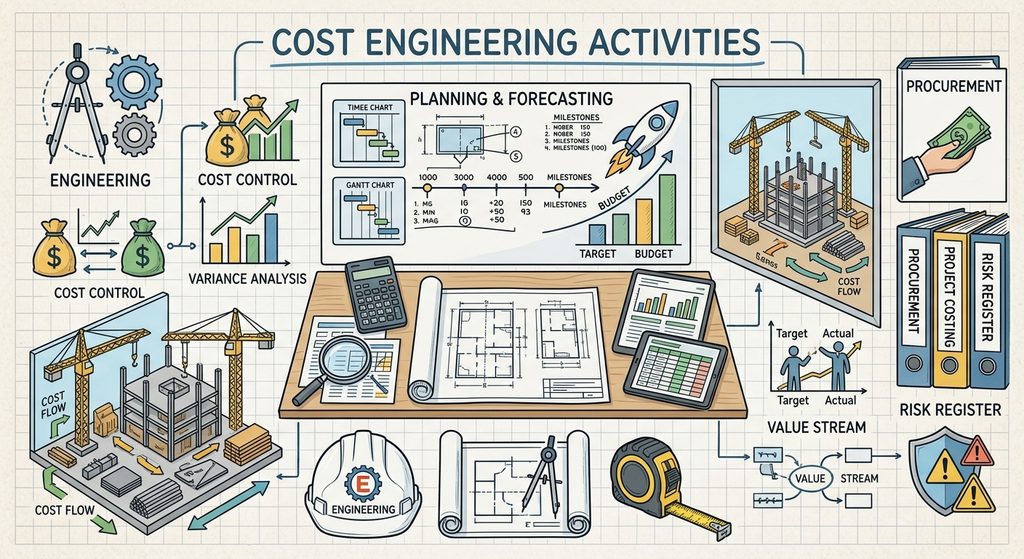
Cost Engineering (Ce): Performs analytical bottom-up evaluations of unit direct industrial costs (€), modeling manufacturing cycle times, material utilization, machine rates, labor rates, and transformation parameters.
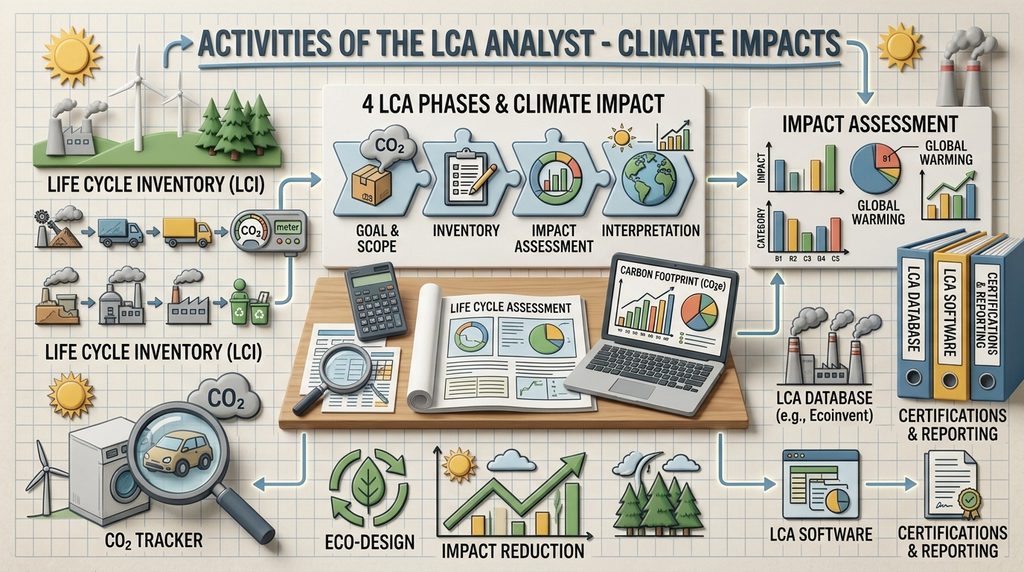
Green Engineering (Ge): Leverages the same process parameters, energy consumption, and material bill data compiled by Cost Engineering to feed LCA engines and certified emission databases, translating the technical specification into unit carbon footprint metrics (kg CO₂e).
The intersection of these parallel evaluations yields the (iER) Index of Eco-Efficiency Ratio [€/kgCO2e] for any component or assembly:
Value Optimization (VO) and the Decision Metric Delta
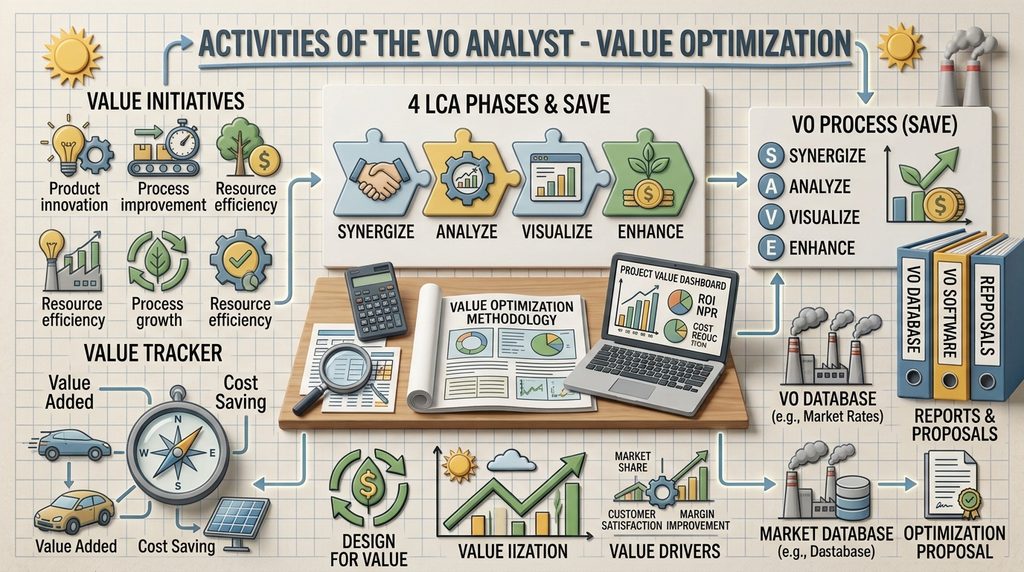
Once the baseline is established, the Value Optimization (VO) team introduces architectural redesigns, material substitutions, process optimizations, or supply chain reconfigurations.
Every proposed design change induces a concurrent shift in both direct cost (€) and carbon footprint (kg CO₂e).
To evaluate the economic-environmental efficacy of each redesign proposal, DtGC defines the Delta Eco-Efficiency Ratio:
ΔiER = iERpost – iERante
[€/kgCO2e]
P&L Integration & Strategic C-Level Impact
A defining capability of the DtGC methodology is its direct, rigorous mapping of engineering design decisions into statutory and managerial Profit & Loss (P&L) statements, establishing a clear link between technical choices and C-Level financial metrics.
P&L Reclassification of Green Deal Costs
Environmental and regulatory financial liabilities directly affect Production Costs (Item B of the European statutory P&L structure) according to the following explicit accounting mapping:
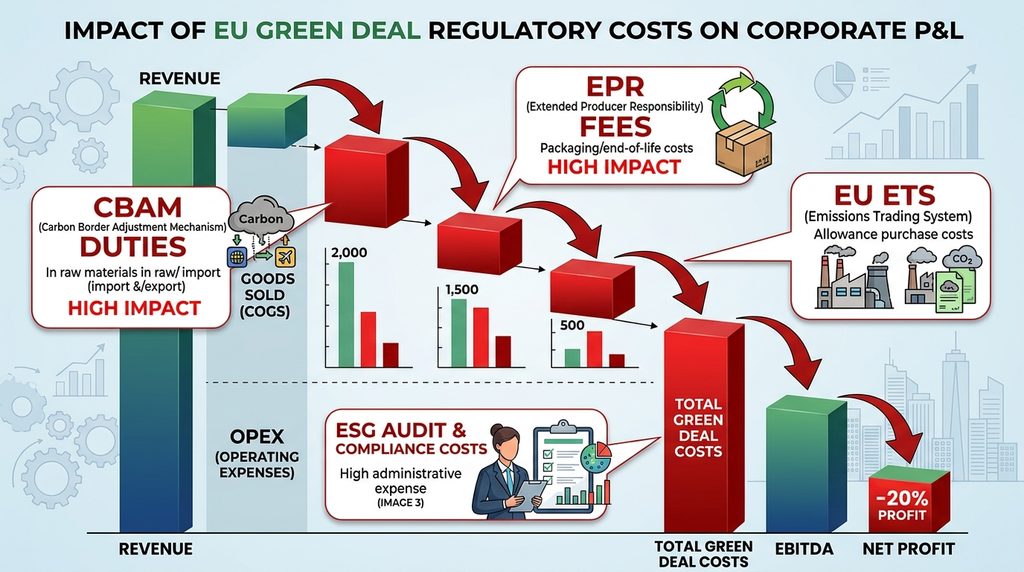
- CBAM Certificates (Imports): Recognized under Raw Materials, Consumables & Goods (B.6) or Other Operating Expenses (B.14) based on volume and carbon intensity of non-EU imports.
- EU ETS Allowances (Processes & Freight): Booked in B.6 for direct surrender allowances or embedded within logistics and freight expenses under Costs for Services (B.7).
- EPR Environmental Levies (Packaging & End-of-Life): Recorded under Costs for Services (B.7) for producer responsibility compliance schemes or B.14 (Other Operating Expenses).
- ESG Audits, Certifications & Advisory: Classified under Costs for Services (B.7).
Mathematical Formulation of Integrated Production Cost
The Total Cost of Production (TCP) combines traditional direct operating costs (Ce) with regulatory environmental liabilities (Green OpEx):
Then:
Because Green OpEx exhibits a primarily linear dependency on carbon allowance market values and embedded product CO₂e mass, normalizing total production costs by total carbon footprint yields:
Since Green Deal compliance liabilities (Green OpEx) exhibit a direct linear dependency on carbon pricing allowances (EU ETS) and embedded emissions (kg CO2e), indexing their financial value directly to the carbon mass transforms the regulatory surcharge into a constant per unit of carbon.
Consequently, when calculating the differential Eco-Efficiency Ratio ( ΔiER ), this constant term cancels out during variance analysis.
This mathematical property allows Cost Engineering teams to evaluate design trade-offs by focusing directly on industrial operating expenditures (Ce), avoiding the need to overburden traditional costing workflows with additional regulatory line items while maintaining absolute alighment with total P&L integrated impacts.
Thus, considering the ratio of total product cost variance to CO2e variance, the constant can be neglected:
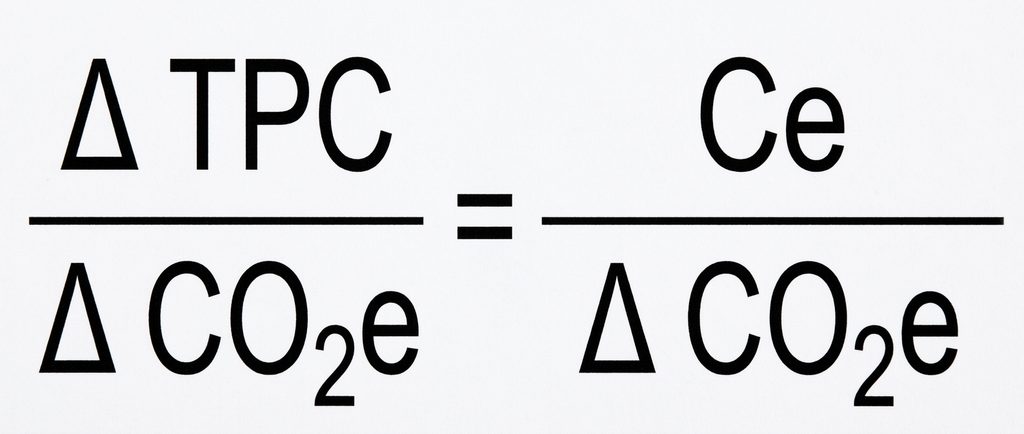
This mathematical equivalence demonstrates complete alignment between executive financial metrics [€/kg CO₂e] and iER Index Eco-Efficiency Ratio [€/kg CO₂e] utilized by Cost and Green Engineering teams.
[ € / kg CO2e ]
Any Value Optimization intervention at the BOM level satisfying ΔiER > 0 directly drives down the Green OpEx burden on corporate operating margins.
Executive Overview: aligning R&D, Procurement and C-Level leadership
To resolve trade-offs between competing design criteria, DtGC introduces a standardized scoring algorithm that evaluates product configurations on a normalized scale from 0 to 100 (where 100 represents the global optimum). DtGC Score:
DtGCscore = [ Wc x (1 – CN )+ We x (1 – EN )+ Wf x FN + Wr x RN ) ] x 100
Synthesizes four core dimensions into a single decision metric, where CN, EN, and RN are minimized and FN is maximized.
Mathematical Definition of Algorithm Parameters
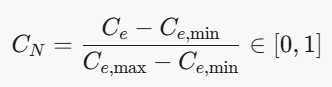
Normalized Integrated Cost (CN): Calculated via Min-Max scaling across all evaluated design alternatives
A lower value indicates a lower total cost ( Ce + Green OpEx)

Normalized Environmental Exposure (EN): Quantifies monetized environmental risk (GreenOpEx)
A value of 0 represents minimal regulatory risk exposure
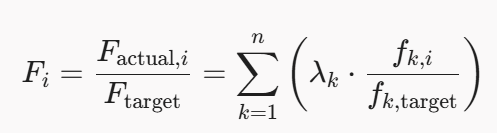
Functional Performance Rating (FN):
It is a normalized dimensionless index (on a scale or percentage [0, 100%]) that quantifies the level of functional performance delivered by the component or assembly.
Calculation Model via Value Engineering (VE): It derives from the Value Engineering & Hard Constraints Validation ( Strategy Phase 2) and is expressed as the ratio between the technical/functional performances delivered by variant i( Factual,i ) and the target functional requirements of the project ( Ftarget)
where fk represents the k-th technical function (e.g., torsional mechanical strenght, stiffness, fatigue life, thermal insulation) and λk is the relative weight of the function.
HARD CONSTRAINT / PASS-FAIL GATE:
Safety requirements, compliance with mandatory regulations, minimum quality standards, and primary functionalities cannot be compensated by a high score on other variables.
Mathematically, they act as an admissibility constraint:
Fi≥Fmin ( if Fi < Fmin, SOLUTION REJECTED and the design is disqualified).

Supply Chain Risk Index (RN): A composite risk index evaluating supply chain vulnerability
where a1 + a2 + a3 = 1.0
It is a normalized composite risk index (scale or [0, 100]%) that quantifies the overall vulnerability of the supply chain associated with the choice of materials and suppliers.
- Rreg (Regulatory Risk): Exposure to future sanctions or volatile customs duties (e.g., volatility of EU ETS allowances or CBAM duties on non-EU countries)
- Rdisp (Availability and Geopolitical Risk): Geographical distance of Tier-1/Tier-2 suppliers, logistical lead times, raw material market concentration, and risk of shortages.
- Rcirc (Circularity and End-of-Life Risk): Index of complexity in dismantling/separating materials, recyclability potential, and adherence to EPR/ESPR directives.
Strategic Governance Weights (Wc , We , Wf , Wr ): Adimensional weighting factors defined by the C-Level Board to align the algorithm with corporate priorities:
Normalization Constraint : Wi

Weight Normalization Condition ( with 0 ≤ Wi ≤ 1 )
They are set by the Executive Board / C-Level in Strategy Phase 1 (Target & Governance Definition) to align the algorithm with the company’s strategic objectives:
- Wc : Weight given to direct industrial cost reduction (Ce).
- We : Weight given to physical decarbonization and the containment of environmental duties (Green OpEx).
- Wf : Weight assigned to over-performance or functional optimization.
- Wr : Weight assigned to risk mitigation along the supply chain.