
Comparative Case Application: Dashboard crossmember
To illustrate the practical financial impact of DtGC, consider a real-world industrial case study.
Product definition (A)
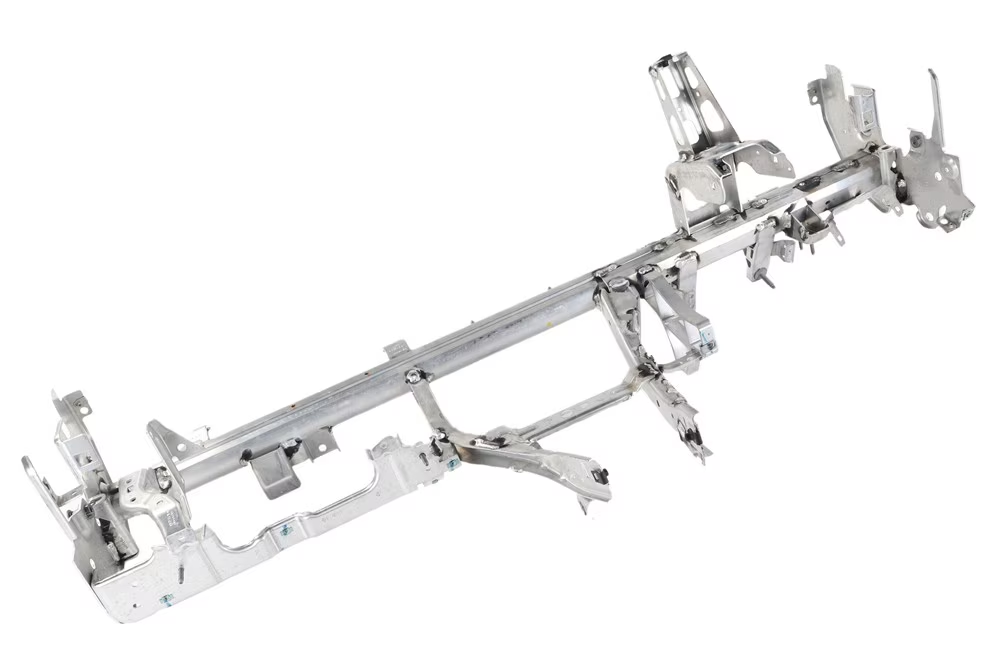
Physical Specifications, Materials & Supply Chain
- Application: Dashboard crossmember.
- Component net Weight: 8.17 kg. (with a raw material scrap arount 15%)
- Dimensions : 135 x 40 x 45 mm
- Material Type: Primary virgin steel.
- Manufacturing Processes: Stamping, Bending and Welding
- Supplier Origin: Non-EU import (China supplier).
- Annual production volume : 300,000 pcs
- Logistics Route: Long-haul route.
Phase 1A – Target & Governance Definition
In this phase, the C-Level Board sets the financial boundaries and governance weightings for the decision algorithm:
- Market-Driven Price = €40.00
- Target Margin = €8.00 (20%)
- Target Cost = Market Price – Margine = € 40.00 – € 8.00 = € 32.00
- Strategic DtGC Score Weights (Wi) : Wc + We + Wf + Wr = 1
- Wc (Cost)= 0.3 (30%)
- We (Green OpEx)= 0.4 (40%)
- Wf (Functional Performance)= 0.1 (10%)
- Wr (Supply Chain Risk)= 0.2 (20%)
- Supply Chain Risk Index (RA) = 0.9 The Extra-EU supplier is evaluated as low vulnerability in a range 0-1
Phase 2A – Value Engineering & Hard Constraints Validation
Engineering teams break down functional requirements and verify non-negotiable minimum thresholds (Pass-Fail Gate):
- Structural Requirements: 9.40 kg gross weight of primary virgin steel.
- Hard Constraint Validation (Fi ≥ Fmin ): Product A satisfies all mechanical and safety requirements (FA = 1.00 ), passing the technical admissibility threshold. Engineering team defined the minimal structural performance index : Fmin = 0.85
Phase 3A – Impact vs. Exposure Separation
Analytical separation between direct industrial costs (Cost Engineering) and environmental liabilities exposure (Green Engineering):
- Cost Engineering :
- Direct Industrial Cost : CeA = € 15.72
- Logistic Cost LogA = € 13.73
- Target Cost of Goods Sold = Target Cost – Log = € 32.00 – € 13.73 = COGSA = € 18.27
- Green Engineering :
- Total Carbon Footprint ( LCA analysis ): GeA = 61.19 kg CO2e
- ESG Controller :
- CBAM Regulation CBAMA = € 1.97
- EPR Directive EPRA = € 0.02
- EU ETS System ETSA = € 0.09
- index Eco-Efficiency Ratio : CeA / GeA = € 15.72 / 61.19 kgCO2e = iERA= 0.25 €/kgCO2e
- Environmental Exposure : CBAMA + EPRA + ETSA = Green OpExA= € 2.08
- Total Integrated Cost of Production : = CeA + LogA + Green OpExA = TCPA= € 31.53
- Extra Target Margin (TCP target – TCP) = Target Cost – TCPA = € 32.00 – € 31.53 = € 0.47 Target Cost PASSED
Phase 4 – Eco-Design Alternatives Generation
Cross-functional teams apply the levers of the 7R Framework (Redesign, Reduce, Recycle, Re-source, etc.) to generate alternative bill of materials (BOM) configurations.
Below we report only the parameters that change compared with Product A
Product B (Full DtGC)
Redesigned structural geometry utilizing European supplier located in Bulgary. Raw material and production costs +10% respect product A.
Physical Specifications, Materials & Supply Chain
- Component net Weight: 7.35 kg (achieving a weight reduction of -10% compared to Product A’s)
- Supplier Origin: EU ( Bulgary).
- Logistics Route: Short regional transportation route.
Phase 1B – Target & Governance Definition
- Supply Chain Risk Index (RB) = 1.00 The EU supplier is evaluated as lower vulnerability
Phase 2B – Value Engineering & Hard Constraints Validation
Engineering teams break down functional requirements and verify non-negotiable minimum thresholds (Pass-Fail Gate):
- Hard Constraint Validation (Fi ≥ F_min ): Product B (FB = 1.00 ) satisfies all the mechanical and safety requirements (Fmin = 0.85), passing the technical admissibility threshold.
Phase 3B – Impact vs. Exposure Separation
Analytical separation between direct industrial costs (Cost Engineering) and environmental liabilities exposure (Green Engineering):
- Cost Engineering :
- Direct Industrial Cost : CeB = € 16.56
- Logistic Cost LogB = € 2.50
- Target Cost of Goods Sold = Target Cost – Log = € 32.00 – € 2.50 = COGSB = € 29.50
- ΔCeB,A = CeB – CeA = € 16.56 – € 15.72 = + € 0.84 (despite the weight reduction, the higher material and production costs made a bigger impact)
- Green Engineering :
- Total Carbon Footprint ( LCA analysis ): GeB = 58.40 kg CO2e
- ΔGeB,A = GeB – GeA = 58.40 kg CO2e – 61.19 kg CO2e = – 2.79 kg CO2e
- ESG Controller :
- CBAMB = € 0.00 (100% eliminated due to EU sourcing)
- EPRB = € 0.02
- ETSB = € 0.00
- iERB = + 0.28 €/kgCO2e
- ΔiERB,A = iERB – iERA = 0.28 €/kgCO2e – 0.25 €/kgCO2e = + 0.03 €/kgCO2e
- Green OpExB = € 0.02
- TCPB = € 19.08
- ΔTCPB,A = TCPB – TCPA = € 19.08 – € 31.53 = – € 12.45
- Extra Target Margin (TCP target – TCP) = € 12.92 Target Cost PASSED
Product Comparison1 : Solution A vs. Solution B (full DtGC)
| Analytical Cost / Exposure Item | Product A | Product B (Full DtGC) | Variance / Delta B vs. A |
|---|---|---|---|
| Component Net Weight (kg) | 8.17 kg | 7.35 kg | -0.82 kg (-10.0%) |
| Direct Industrial Cost (Ce) | € 15.72 | € 16.56 | + € 0.84 (+5.4%) |
| CBAM Regulation | € 1.97 | € 0.00 (EU) | – € 1.97 (-100%) |
| EPR Directive | € 0.02 | € 0.02 | – € 0.00 (0.00%) |
| EU ETS System | € 0.09 | € 0.00 | – € 0.09 (-100.0%) |
| Total Exposure (Green OpEx) | € 2.08 | € 0.02 | – € 2.06 (-99.0%) |
| Integrated Cost (TCP) | € 31.53 | € 19.08 | – € 12.45 (-39.5%) |
| Extra Target Margin | € 0.47 | € 12.92 | + € 12.45 |
| Outcome vs. Target Margin | Baseline | Target Surpassed | Target Achieved |
Product C (traditional DtC)
Traditional Design to Cost :
- Redesigned structural geometry : weight reduction (-10%),
- Material and production costs discount (-10%),
- Low-Cost Extra-EU Sourcing: China supplier with lower quality.
Physical Specifications, Materials & Supply Chain
- Component net Weight: 7.35 kg (achieving a weight reduction of -10% compared to Product A’s)
- Supplier Origin: Non-EU import (China supplier).
- Logistics Route: Short regional transportation route.
Phase 1C – Target & Governance Definition
- Supply Chain Risk Index (RC) = 0.75 The Extra-EU supplier is evaluated as lower vulnerability
Phase 2C – Value Engineering & Hard Constraints Validation
Engineering teams break down functional requirements and verify non-negotiable minimum thresholds (Pass-Fail Gate):
- Hard Constraint Validation (Fi ≥ F_min ): Product C (FC = 0.90 > 0.85 ) satisfies all the mechanical and safety requirements (Fmin = 0.85), passing the technical admissibility threshold.
Phase 3C – Impact vs. Exposure Separation
Analytical separation between direct industrial costs (Cost Engineering) and environmental liabilities exposure (Green Engineering):
- Cost Engineering :
- Direct Industrial Cost : CeC = € 13.60
- Logistic Cost LogC = € 13.73
- Target Cost of Goods Sold = Target Cost – OpEx = € 32.00 – € 13.73 = COGSC = € 18.27
- ΔCeC,A = CeC – CeA = € 13.60 – € 15.72 = – € 2.12 ( thanks to the weight reduction and lower the material and production costs)
- Green Engineering :
- Total Carbon Footprint ( LCA analysis ): GeC = 67.31 kg CO2e ( due to the lower quality of the Chinese supplier )
- ΔGeC,A = GeC – GeA = 67.31 kg CO2e – 61.19 kg CO2e = + 6.12 kg CO2e
- ESG Controller :
- CBAMC = € 2.17
- EPRC = € 0.02
- ETSC = € 0.09
- iERC = + 0.20 €/kgCO2e
- ΔiERC,A = iERC – iERA = 0.20 €/kgCO2e – 0.25 €/kgCO2e = – 0.05 €/kgCO2e
- Green OpExC = €2.28
- TCPC = € 29.61
- ΔTCPC,A = TCPC – TCPA = € 29.61 – € 31.53 = – € 1.92
- Extra Target Margin (TCP target – TCP) = + € 2.39 Target Cost PASSED
Product Comparison2 : Solution A vs. Solution C (traditional DtC)
| Analytical Cost / Exposure Item | Product A | Product C (traditional DtC) | Variance / Delta C vs. A |
|---|---|---|---|
| Component Net Weight (kg) | 8.17 kg | 7.35 kg | -0.82 kg (-10.0%) |
| Direct Industrial Cost (Ce) | € 15.72 | € 13.60 | – 2.11 (-13.4%) |
| CBAM Regulation | € 1.97 | € 2.17 | + € 0.20 (+10.0%) |
| EPR Directive | € 0.02 | € 0.02 | € 0.00 (0.0%) |
| EU ETS System | € 0.09 | € 0.09 | € 0.00 (-0.0%) |
| Total Exposure (Green OpEx) | € 2.08 | € 2.28 | + € 0.20 (+9.5%) |
| Integrated Cost (TCP) | € 31.53 | € 29.61 | – € 1.92 (-6.1%) |
| Extra Target Margin | € 0.47 | € 2.39 | + € 1.92 |
| Outcome vs. Target Margin | Baseline | Target Surpassed | Target Achieved |
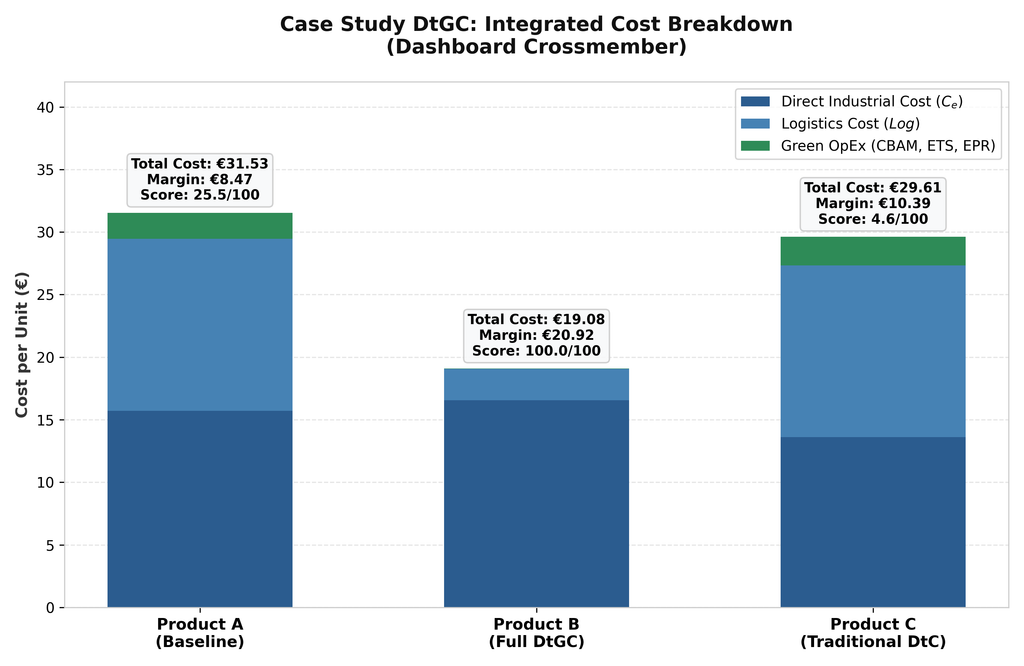
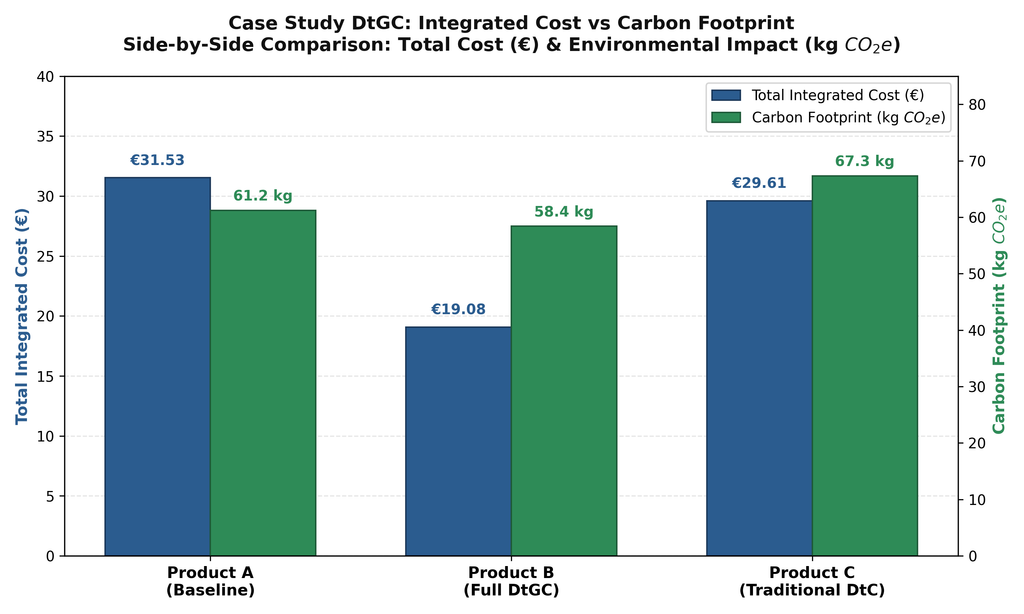
Pursuing unit price discounts without accounting the environmental impact ( Δ Ge = + 9.5%), leaves the product exposed to €2.28 in green liabilities.
Phase 5 – Integrated Dual-Gate Decision Makin
Evaluation of the design option through the two-gate model prior to the technical freeze:
Gate 1 – R&D & Engineering (Technical Eco-Efficiency Check):
Δ iER Comparison : Solution A,B,C
| Metric | Product A (Baseline) | Product B (Full DtGC) | Product C (traditional DtC) |
|---|---|---|---|
| Description | Conventional supplier Extra-EU | Eco-Design: -10% kg EU | Value Optimization: -10% kg Low-Cost supplier Extra-EU |
| Direct Industrial Cost (Ce) | € 15.72 | € 16.56 | € 13.60 |
| Total Exposure (Green OpEx) | € 2.08 | € 0.02 | € 2.28 |
| Logistic Cost (Log) | € 13.73 | € 2.50 | € 13.73 |
| Total Integrated Cost (TCP) (Target Cost = 32.00 €) | € 31.53 | € 19.08 | € 29.61 |
| Carbon Footprint (Ge) | 61.19 kg CO₂e | 58.40 kg CO₂e | 67.31 kg CO₂e |
| Direct Industrial Cost Delta (Δ Ce) | Baseline | + € 0.84 | – € 2.12 |
| Integrated Cost Delta (Δ TCP) | Baseline | – € 12.45 | – € 1.92 |
| Emissions Delta (Δ Ge) | Baseline | – 2.79 kg CO₂e | + 6.12 kg CO₂e |
| Eco-Efficiency Ratio ( iER ) | 0.25 €/kg CO₂e | 0.28 €/kg CO₂e | 0.20 €/kg CO₂e |
| Delta Eco-Efficiency Ratio (Δ iER) | Baseline | + 0.03 €/kg CO₂e | – 0.05 €/kg CO₂e |
| Extra Target Margin | + € 0.47 (Target Surpassed) | + € 12.92 (Target Surpassed) | + € 2.39 (Target Surpassed) |
| Green Deal Cost Impact (Product Changes) | Baseline | Reduction | Increase |
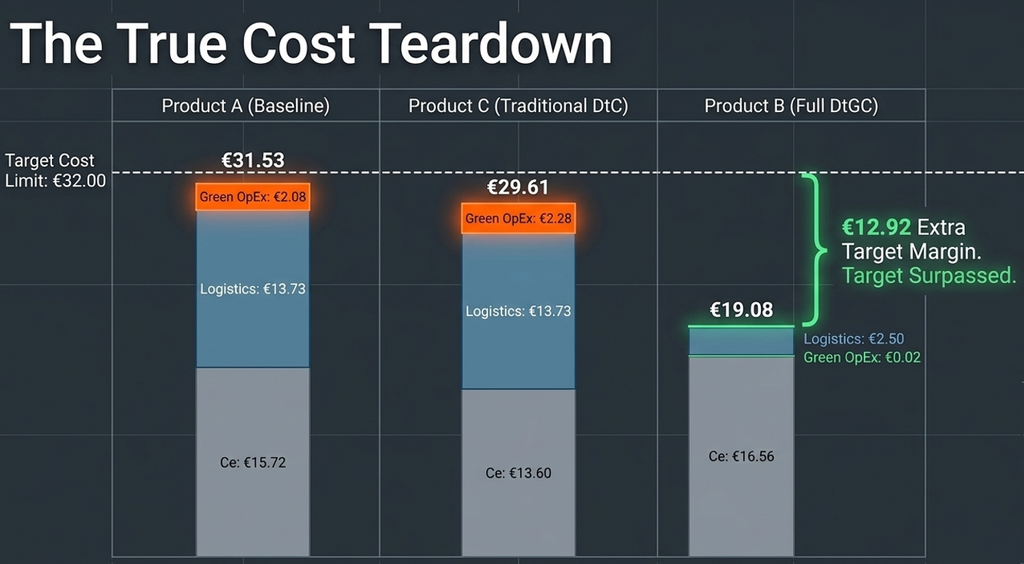
Key Notes
- Product B achieves deep decarbonization (-2.79 kg CO₂e , -4.6%) while simultaneously cutting overall integrated costs by €12.45 thanks to this carbon reduction.
- Product C yields slightly higher short-term cost savings (-€2.11 , -13.4%) but with a carbon increase (+ 6.12 kg CO₂e, +10.0%), leaving the organization heavily exposed to future environmental levies (€2.28 residual exposure).
Gate 2 – C-Level Board & ESG Controller (Strategic Selection):
Quantitative Step-by-Step Calculation: Min-Max Normalization & DtGC Score
Using the corporate strategic weights Wc = 0.30, We = 0.40, Wf = 0.10, and Wr = 0.20, the min-max normalization values across the four alternatives are calculated as follows:
| Product Option | CN (Integrated Cost) | EN (Green OpEx) | FN (Function) | RN (Supply Risk) | DtGCscore |
|---|---|---|---|---|---|
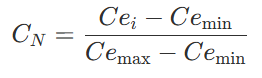 | 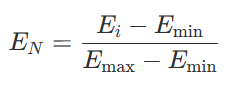 | 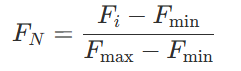 | 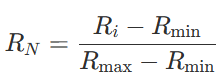 | Wc x (1 – CN )+ We x (1 – EN )+ Wf x FN + Wr x RN ) | |
| Product A (Baseline) | 1.00 | 0.91 | 1.00 | 0.60 | 25.50 |
| Product B (Full DtGC) | 0.00 | 0.00 | 1.00 | 1.00 | 100.00 |
| Product C (Trad. DtC) | 0.85 | 1.00 | 0.00 | 0.00 | 4.62 |
Comparative Results Matrix: iER vs. DtGC Score
The summary matrix below presents the financial, environmental, and strategic evaluation across all four product options
- Cost Engineerign, Green Engineering & Value Engineering are focus on the ΔiER
- Financial & Purchasing department are focus on DtGC Score
| Option | Ce (€) | Log (€) | Green OpEx (€) | TCP (€) | Ge (kg CO2e) | iER (€/kg) | ΔiER (€/kg) | DtGC Score | Net Margin (€) |
|---|---|---|---|---|---|---|---|---|---|
| Product A (Baseline) | 15.72 | 13.73 | 2.08 | 31.53 | 61.19 | 0.25 | Base | 25.50 | 8.47 |
| Product B (DtGC) | 16.56 | 2.50 | 0.02 | 19.08 | 58.40 | 0.28 | +0.03 | 100.00 | 20.92 |
| Product C (trad. DtC) | 13.60 | 13.73 | 2.28 | 29.61 | 67.31 | 0.20 | -0.05 | 4.62 | 10.39 |
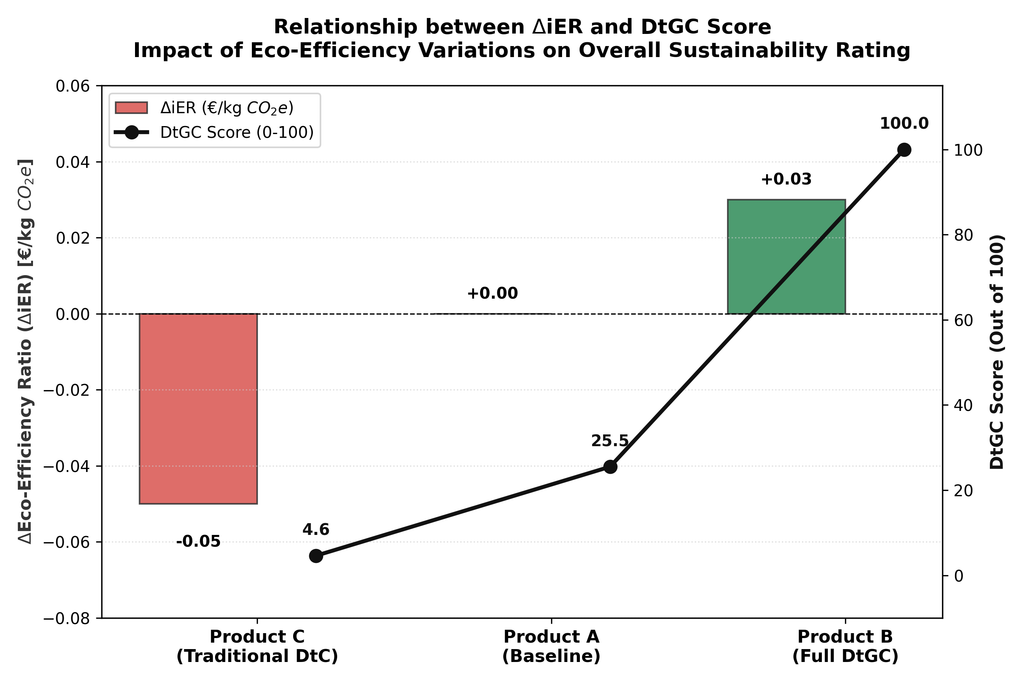
Key Executive Takeaways & Strategic Insights
- Product B is the Global Winner (DtGC Score 100/100):
Although Product B incurs a +0.84 € direct industrial material premium, its eco-design architecture reduces carbon emissions by 4.6% and eliminates CBAM tariffs. Green OpEx drops from €2.08 to €0.02, yielding a total integrated cost of €19.08 (below the €32.00 target) and delivering the highest sustainable net margin (€20.92 vs €8.00 target).- The Failure of Traditional Cost Management (Product C – DtGC Score 4.62/100):
Sourcing a lower purchase price (-€2.11) without addressing carbon intensity increases environmental liabilities (€2.28). The real net operating margin collapses to €10.39.
Phase 6 – Monitoring & Continuous Improvement (PDCA)
Continuous tracking and P&L reconciliation led by the ESG Controller:
- ESG Controller Diagnosis: Identifies that Product A exposes the company to severe financial vulnerabilities (realized margin of only € 8.47 ) and heavy dependency on carbon tariffs and ETS market fluctuations.
- PDCA Cycle: The optimization of Product A triggers an immediate Redesign Loop, steering the engineering team toward low-carbon, low-integrated-cost solutions.
The Delta Ratio (ΔiER > 0) serves as a decision-making compass, indicating that a design modification is expected to reduce Green OpEx relative to the reference configuration.
It empowers cost engineers, green engineers, and value engineers to align their respective disciplines, transforming the regulatory pressures of the Green Deal into a strategic lever for optimizing corporate costs and achieving sustainable profitability.